The lake that breathes
Vallecito fills to the brim by early July and gives nearly half of itself away by winter. Every year, on purpose.
Where the lake sits today
Reclamation reading for Sep 30 · checked Oct 1, 6:16 PM
Live figure is the same Bureau of Reclamation reading shown on the conditions dashboard and the site ticker.
Two numbers, and they are not the same. Nominal capacity is 129,700 acre-feet at elevation 7,665 ft — the design number, and the denominator behind every percentage on this page. The operating pool is what managers actually fill to today: roughly 123,500–125,600 acre-feet, about a foot below the spillway gates, ever since the spillway inspection.
So a completely full Vallecito now reads around 95–97% on these charts, not 100. When this page says the lake “filled” or “hit full pool,” it means it reached that operating pool — the practical ceiling — not the nominal 129,700.
A year in the life
Vallecito is a working reservoir, not a natural lake, and it keeps a working calendar. Snowmelt off the Weminuche pours in through spring; the pool climbs from mid-April and tops out in the first days of July. Then the giving begins — irrigation releases down the Pine River all summer, a long, deliberate exhale that bottoms out just before Christmas. The gray dashed line below is the typical year, drawn from the full daily record; the blue line is 2026. Overlaid in rust and amber are 2002 and 2018 — the two lowest years on record — so you can read this year against the historic droughts on the same chart.
% of full pool = storage ÷ 129,700 acre-feet nominal capacity. Curve = weekly median of the daily record, 1941–2026; shaded band = the 25th–75th percentile (a normal year lives inside it). The 2002 and 2018 lines are the driest years in the record.
The promise the lake keeps was written in 1941. Built between 1938 and 1941 on a low bid of $2,115,870 — with the Weston Lumber Company taking the saleable timber off what is now the lakebed and Civilian Conservation Corps crews burning the brush behind them — Vallecito Dam was designed to catch the spring flood and meter it back out across the summer to roughly 54,000 acres of farm and ranch land downstream. One-sixth of that water is delivered to Southern Ute lands under an 1868-priority right, confirmed in a 1988 settlement. The rhythm you see in the chart is that job, performed once a year for eighty-five years. What stood on that ground before the water — ranches, a wagon road, a Forest Service ranger station — is its own story: The Valley Under the Lake.
In a typical year Vallecito swells to about 112,000 acre-feet in the first days of July, then exhales 58,000 acre-feet — 45 percent of its entire capacity — by mid-December.
Sources: Bureau of Reclamation — Pine River Project · Pine River Irrigation District — project history · Living New Deal — Vallecito Dam.
Eighty-five years, one chart
Every bar is one year's high-water mark, as a share of full pool. Wet decades stack tall; drought years drop away. The tallest month-end peak on record belongs to 2011 at 96.6 percent — but the all-time crest is older and briefer.
Annual peaks are month-end values; true daily peaks run about 1–3% higher. The all-time daily record — 126,792 acre-feet (97.8%), July 27, 1957 — sits above its month-end bar for that reason. 1941, the first partial fill, is excluded.
Read left to right, it is a portrait of the San Juan climate: the strong runoff of the 1980s and 1990s, the deep notch of the 2002 drought (a peak of just 49%), the near-fills of 2011, 2019, and 2023, the shortfall of 2018 (66%), and 2026, which crested unusually early — in April, at 92% — and was already sliding by mid-summer.
The dry years
Two summers stand out for how little water there was. The chart traces 2002 and 2018 against the typical year — both starting low, both never catching up.
% of full pool = storage ÷ 129,700 acre-feet. Weekly values from the Bureau of Reclamation daily record.
2002: the year of the firestorm
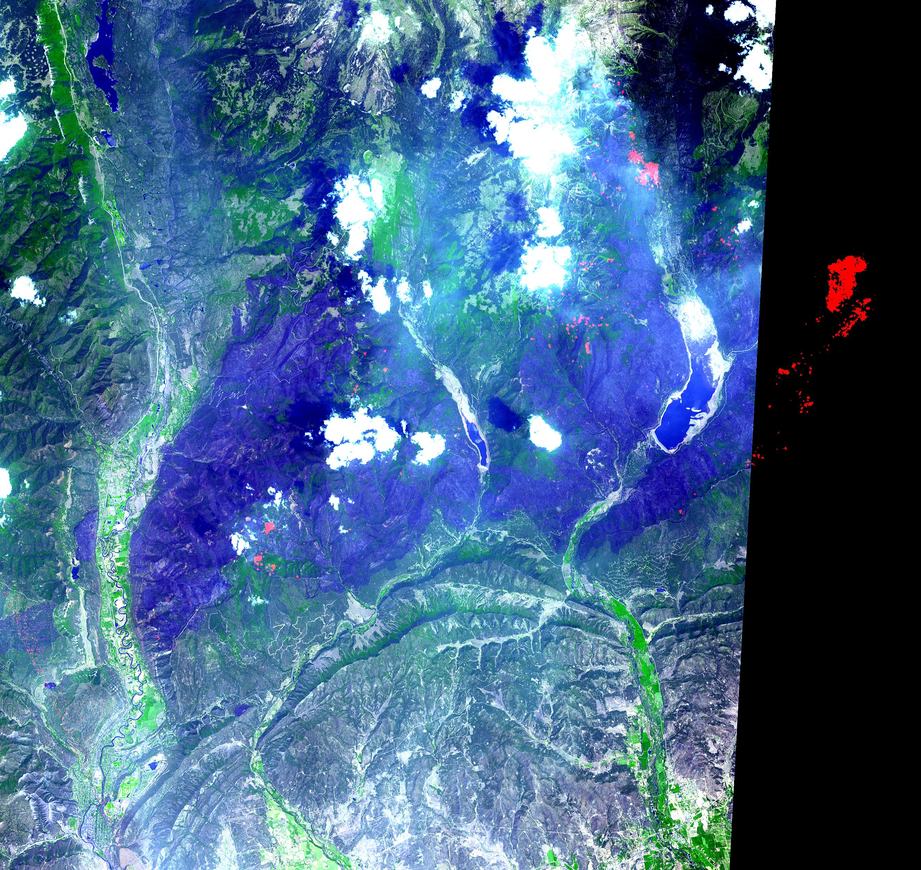
In 2002 the lake never got even half full. It peaked at about 49% (64,007 acre-feet) in April and fell all summer, bottoming at 14,855 acre-feet — 11.5% of capacity — on September 7. That was the summer the Missionary Ridge Fire burned the mountains around the lake, and on June 17 a fire whirl touched down on the exposed, drawn-down lakebed and burned vehicles left on the flats (Durango Herald, 20 years later). From orbit, the shrunken reservoir and the fresh burn scar shared a single frame.
2018: dropping six thousand a week
2018 was the next-worst drought of the modern record. The lake reached about 69% in mid-May, then fell fast — thousands of acre-feet a week through the heat of summer — and kept dropping to a low near 16% (20,667 acre-feet) on September 28. The marina's courtesy dock was left sitting in the mud; only 2002 had been worse (Durango Herald).
The comeback pattern
Here is the counterweight, and it is the most important thing the long record shows: every crash has refilled within one or two snowmelt seasons. The dry year of 1977 was followed by a record 1978. The 2002 low was made up by 2004. A dismal 2013 was rescued by the September 2013 flood and a full 2014. 2018's shortfall gave way to a nearly-full 2019, and the lean winters of 2021–22 were erased by a brimming 2023.
The 2019 comeback was the stuff of local legend. A 160% snowpack drove one of the three or four biggest runoffs in the reservoir's history, and the lake filled to within a quarter-inch of the top without ever using the spillway — a feat the dam-keeper savored out loud.
“We had conquered the winter of 2018-2019.” Ken Beck, Pine River Irrigation District superintendent, to the Durango Herald
By 2023 the problem had flipped from too little to too much, too fast — a good problem, managed one release at a time.
“I've got lots of water coming my way — and I need a hole to put it in.” Ken Beck, on staging spring space for a big runoff (Durango Telegraph)
The spillway problem
There is a reason Vallecito is rarely allowed to touch its true full pool anymore. After the 2017 Oroville Dam spillway failure in California, dam owners nationwide re-inspected their own. A dye test at Vallecito found piping and voids — some up to four feet by ten feet — beneath the spillway. The Bureau of Reclamation ordered the pool held about one foot below the radial gates ever since, which is why “full” on this page tops out a little under the nominal capacity.
That margin quietly paid off on October 11, 2025, when the remnants of Hurricane Priscilla stalled over the San Juans. Vallecito Creek ran to just over 7,000 cubic feet per second (a provisional USGS peak of 7,220), some 390 homes were told to evacuate, and the flood was manageable only because the reservoir was already drawn down for the season — there was, in Beck's phrase, a hole to put the water in. The full account is on The October 2025 Flood.
The longer question is now on the table. A 2026 engineering study is weighing whether to replace the aging spillway or decommission the dam — a decision measured in the hundreds of millions of dollars and, potentially, in years of the reservoir sitting partly empty during construction (Durango Herald: “aging Vallecito needs a serious makeover”). The Pine River Irrigation District has led the spillway investigation and holds its own inspection imagery; those photos are shared by permission (jamie@pridgov.org) and are described here rather than reproduced.
The long view
Average the whole record by decade and a gentler signal appears underneath the year-to-year noise.
Each bar = the mean daily fill across that decade (2020s bar covers 2020–2025). % of 129,700 acre-feet.
The 1990s were the wettest decade on the books, averaging about 61% full. The last twenty-five years run several points lower, with droughts clustering more tightly together. Just as telling is when the water arrives: the spring peak has been creeping earlier. Runoff that once reliably crested in June now often tops out in May — and, in 2026, in April. Peaks in May-or-earlier were rare in the first half of the record and are common in the second.
None of this is destiny, and a single big snow year can still fill the lake to the brim, as 2019 and 2023 proved. But the trend toward earlier, flashier runoff is consistent with regional snowpack research (Climate, 2025) and with the Natural Resources Conservation Service's note of an unusually early 2026 melt. It is worth watching, not fearing.
Records corner
| Record high | 126,792 acre-feet (97.8%), elevation 7,665.5 ft — July 27, 1957 |
|---|---|
| Record low | 608 acre-feet (elevation 7,584.1 ft) — October 24, 1944, in the early-operations era, when the reservoir was still being drawn down hard between filling seasons |
| Last time it filled to the operating pool | June 6, 2020 |
| Lowest of the modern era | 2002 — bottomed at 14,855 acre-feet (11.5%) on September 7 |
| October 2025 refill | The drawn-down pool rose 59,855 acre-feet — from 29,067 on Sept 30 to 88,922 on Oct 31 — as the October flood filled it (43% of the seasonal median at the end of September, 138% of normal by the end of October) |
| 2026's oddity | Record-high storage for the date on 123 straight days, January through May — then a bottom-quartile summer by mid-July |
Storage figures are Bureau of Reclamation month-end and daily values; percentages are of 129,700 acre-feet nominal capacity. The 1957 crest is reported at elevation 7,665.5 ft — half a foot above the 7,665 ft usually quoted for full pool. The two come from different Reclamation datums and eras, and we publish both as reported rather than quietly reconciling them. Early-operations lows (1940s) reflect aggressive between-season drawdown as much as drought.
Deep time
Long before the dam, water wrote this valley's name. “Vallecito” — little valley — sits below the outlet of an Ice Age glacial lake that failed catastrophically. Geologists call the result the Vallecito Flood, a glacial-outburst megaflood whose boulders were carried some 72 miles downstream, as far as Farmington, New Mexico (Colorado Geological Survey). The valley has always been a place where water gathers, waits, and then moves.
In human memory, the case for a dam was made by a flood too. In 1911, the Animas ran at roughly 25,000 cubic feet per second and took out more than a hundred bridges across the region. Catching that kind of spring water — and doling it out through the dry months — is exactly what the farmers and the Bureau of Reclamation set out to do a generation later. The breathing lake is the answer they built.
The two creeks that fill the lake
The reservoir's rise is really the story of two streams. Vallecito Creek drops out of the Weminuche into the north end and does most of the filling; the Los Piños (Pine) River feeds the upper end above the reservoir. Both run the same seasonal shape as the snowpack: a hard spring-runoff spike that peaks in late May and early June, then a long summer tail. These are the same USGS gauges behind the live streamflow tile on conditions — here they're shown across their whole record.
Vallecito Creek near Bayfield
USGS 09352900 · daily discharge record since 1963.
Los Piños River above Vallecito
USGS 09352800 · daily discharge record since 2018 (a shorter record, so its median is “since 2018”).
Discharge in cubic feet per second (cfs). Curves = weekly day-of-year median of the USGS daily record; shaded band = 25th–75th percentile. This-year line refreshes daily; live real-time flow is on the conditions dashboard. Source: U.S. Geological Survey NWIS.
Sources & credits
Data. Bureau of Reclamation reservoir storage via UC Hydrodata (site 933), the daily record since May 3, 1941, joined with NRCS AWDB monthly and daily readings; weekly curves, annual peaks, drought overlays, decadal means, and extremes were precomputed from that record. Live figures come from the Bureau of Reclamation feed on our conditions dashboard. Analysis by GoVallecito.
- U.S. Bureau of Reclamation — Pine River Project
- Pine River Irrigation District — project history & spillway investigation
- Living New Deal — Vallecito Dam & Reservoir
- Durango Herald — Missionary Ridge Fire 20-years-later retrospective; Vallecito second-lowest-on-record (2018); the 2019 fill; “aging Vallecito needs a serious makeover” (2026 spillway study); the October 2025 flood
- Durango Telegraph / Salt Lake Tribune — Ken Beck on staging spring space for a big runoff
- Colorado Geological Survey — the Vallecito Flood (glacial-outburst megaflood)
- Climate (MDPI), 2025 — San Juan snow-water-equivalent trends; NRCS 2026 early-melt note
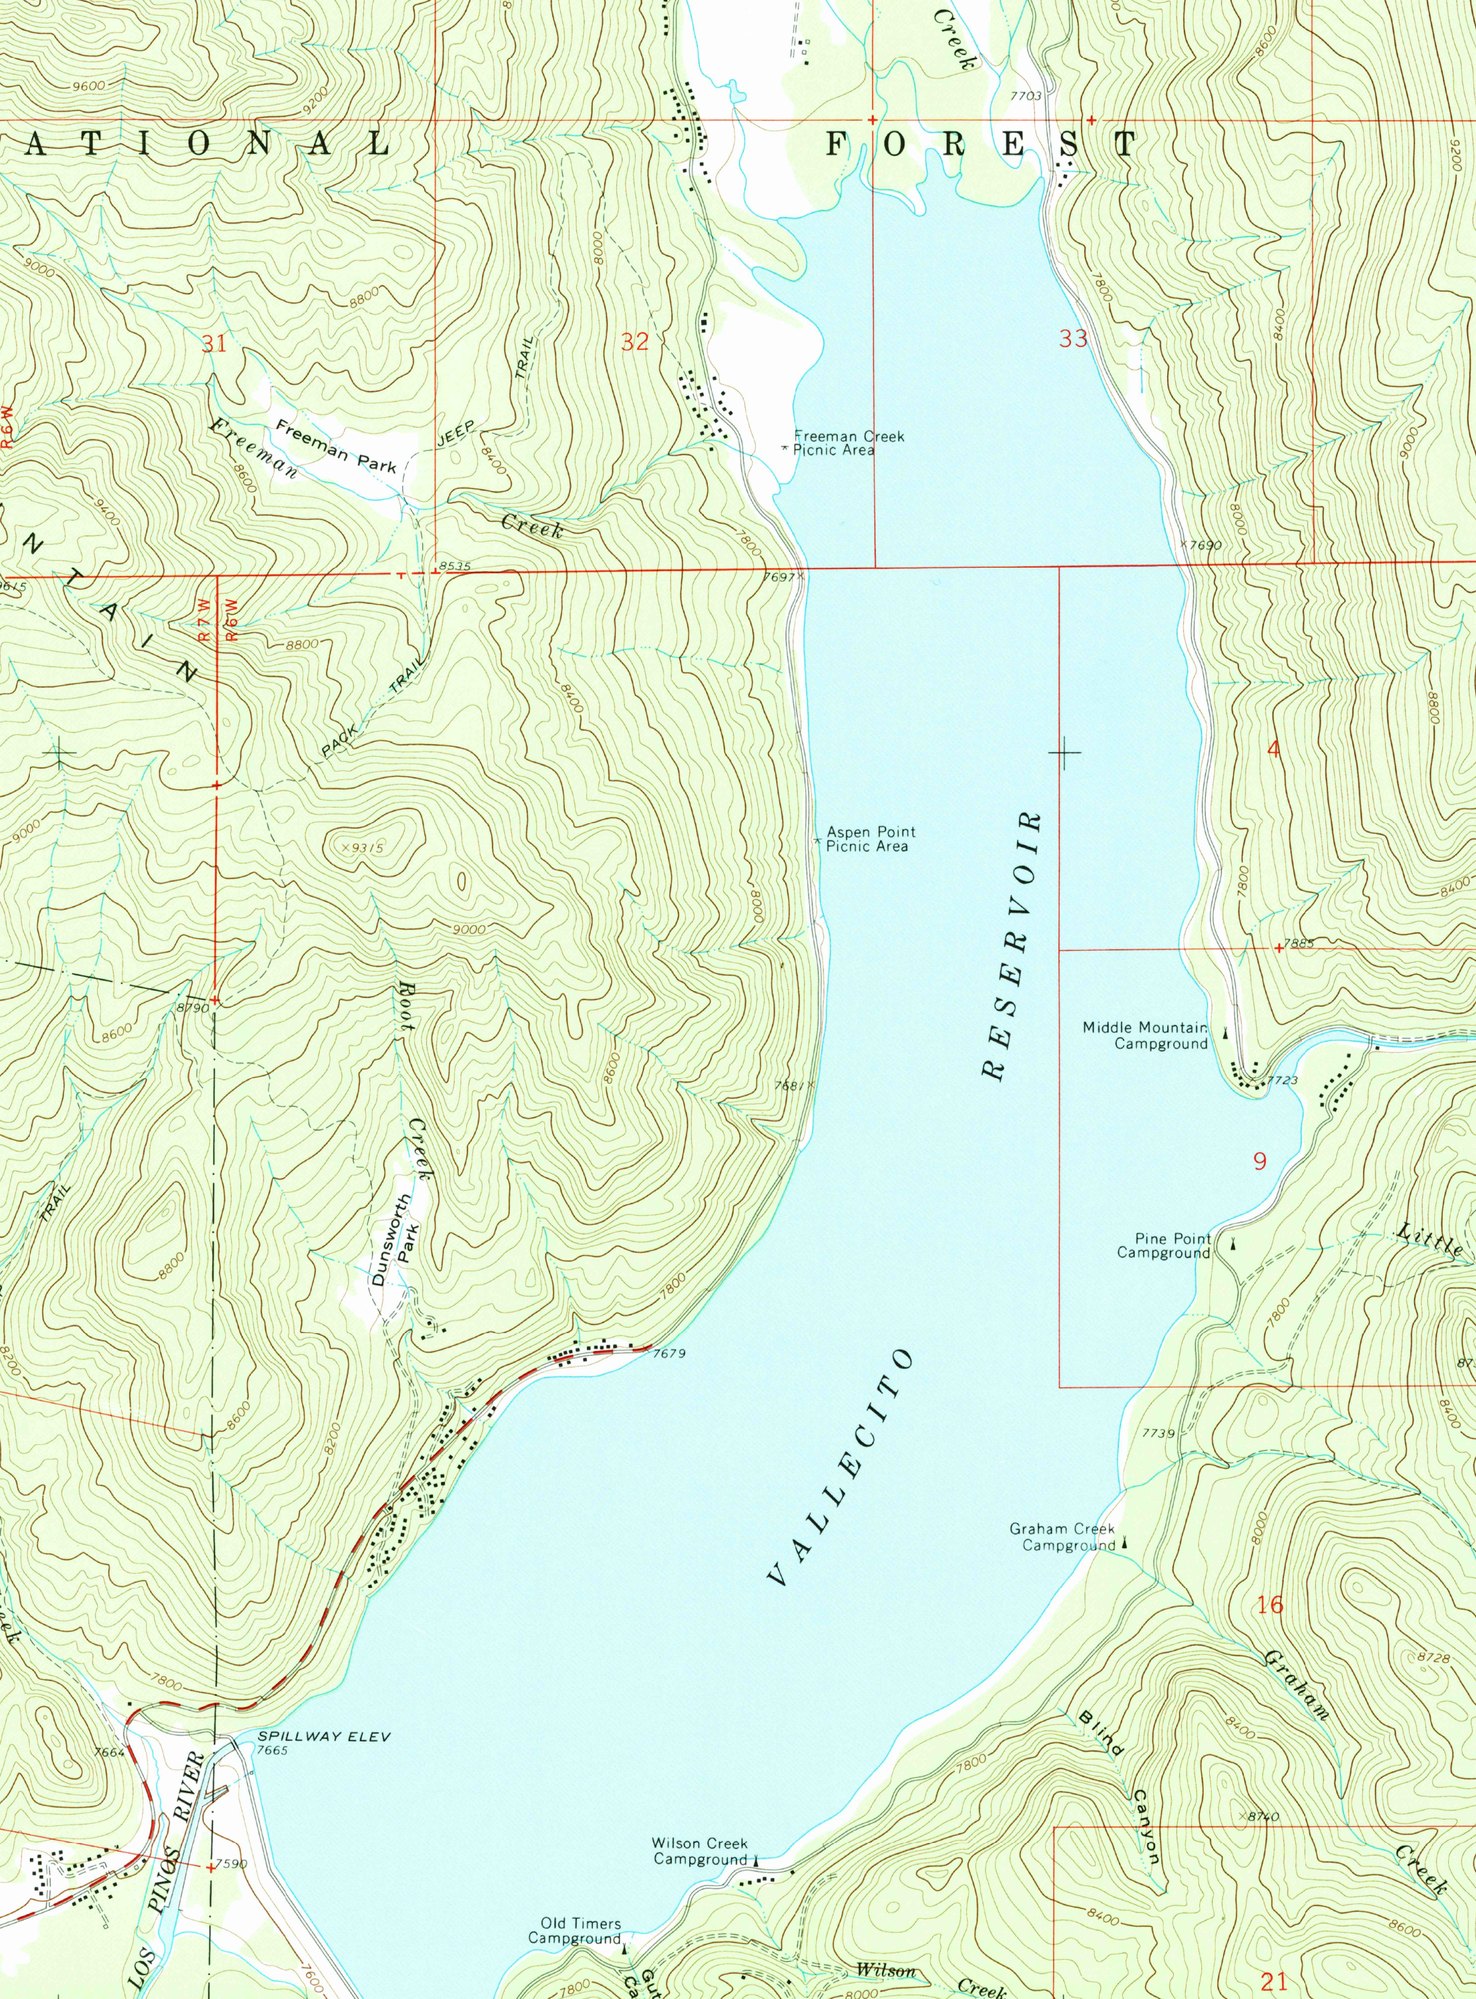
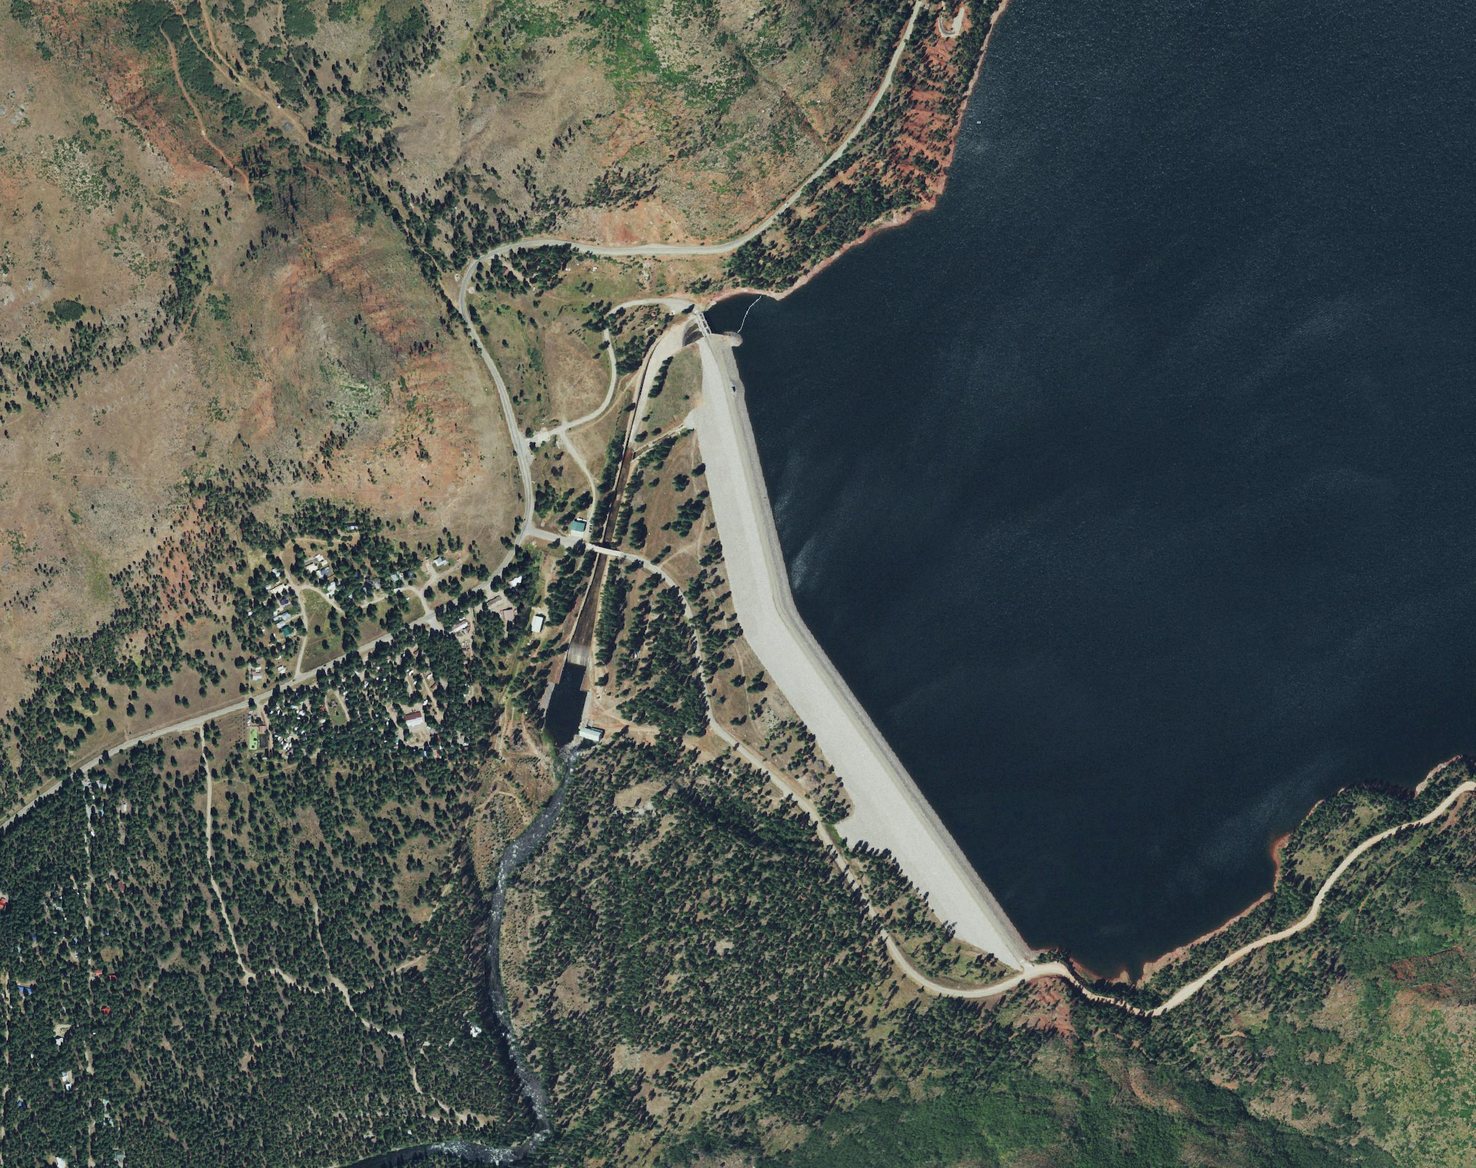
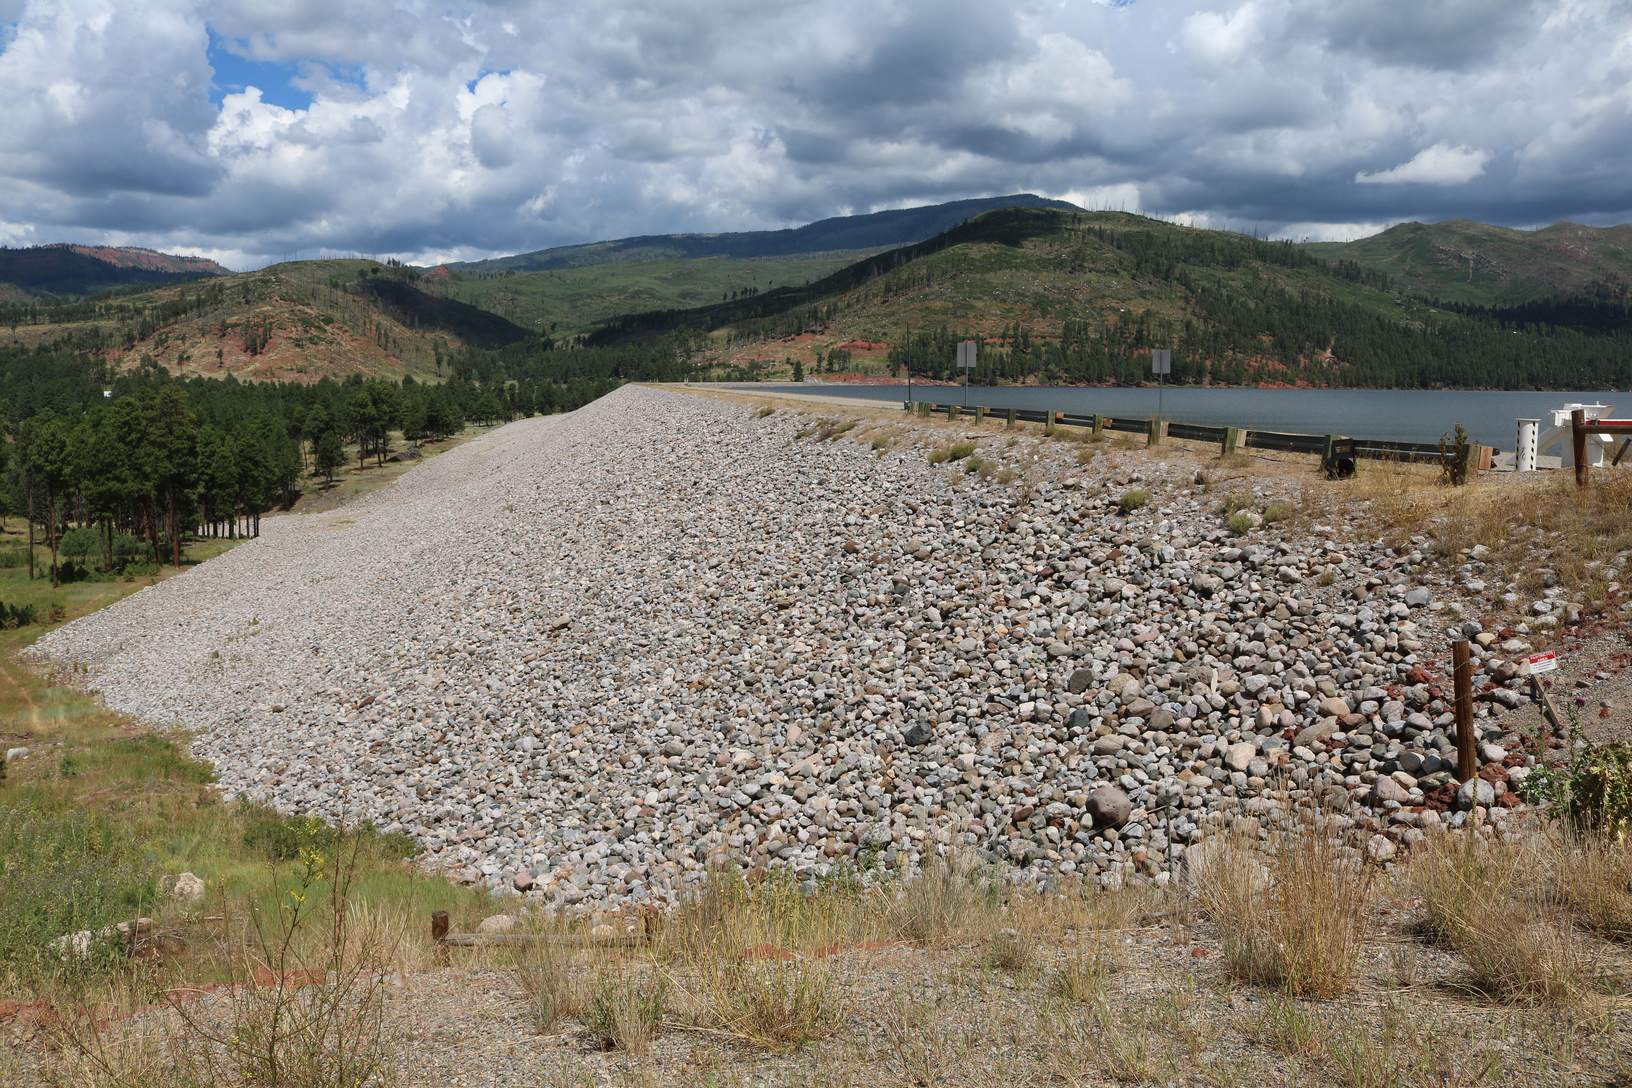
Photographs and maps. Header, share image and the overhead view of the dam: NAIP aerial imagery flown September 9 and 12, 2019 — USDA Farm Service Agency, via USGS The National Map, public domain. The 1964 map: USGS Vallecito Reservoir quadrangle, 1:24,000, mapped by the U.S. Forest Service, from the USGS Historical Topographic Map Collection, public domain. Satellite image: NASA/GSFC/MITI/ERSDAC/JAROS, and U.S./Japan ASTER Science Team. Modern dam: Jeffrey Beall, CC BY 4.0. PRID spillway-investigation imagery is used by permission only and is described in text, not shown.
This is a living community record — corrections and additions are welcome. How to suggest a correction · See the live lake level and the last 730 days